PowerBI Scorecards 101: everything you need to start

Joel Monteiro
2024-05-12PowerBI Scorecards 101 is a thorough guide covering all aspects of the latest version of DevScope’s scorecard platform. Due to the complex nature of scorecards and KPIs, PowerBI Scorecards 101 assumes that you are familiar with these concepts as well as this application’s scorecard framework.
Originally launched in 2017, PowerBI Scorecards was the second product in our PowerBI Tiles product line, a scorecard platform that leveraged Power BI to give organizations a way to visualize the performance of their employees, teams, and business areas.
Three years later, we have a completely revamped and more user-friendly version of PowerBI Scorecards. Similar to what we did with PowerBI Robots and PowerBI Tiles Pro before, PowerBI Scorecards 101 covers PowerBI Scorecards’ most important functions and will receive updates alongside our platform.
Follow the steps in this PowerBI Scorecards 101 guide to learn how to use it:
- What is PowerBI Scorecards?
- Who should use PowerBI Scorecards?
- Registering for PowerBI Scorecards and activating your account
- Navigating PowerBI Scorecards
- Configuring a KPI
- Configuring a scorecard
- Importing/Exporting scorecards and KPI targets
- Connecting Power BI to PowerBI Scorecards
1. What is PowerBI Scorecards?
PowerBI Scorecards is a centralized scorecard and key performance indicators (KPIs) platform that uses Microsoft Power BI as a tool for data visualization and analysis. Unlike traditional performance assessment systems, PowerBI Scorecards is a super flexible platform designed to also work as a management tool. Among others, this lets companies set up individual and team goals, compensation, resource allocation, planning, feedback, and strategic learning KPIs.
PowerBI Scorecards allows organizations to implement strategies and make big decisions backed by a centralized system that monitors and displays productivity in an easy to read yet educated way.
You can try PowerBI Scorecards in your organization for free for 30 days by following this link and clicking Try it Now.
2. Who should use PowerBI Scorecards?
PowerBI Scorecards is useful for organizations who need to:
- Measure and track the performance of their teams or employees
- Centralize the many indicators they work within a single platform that aggregates them
- Stop spending their time searching for the many KPIs they scattered across multiple formats and applications
- Automate their scorecard process and free employees from manually entering data, a time-consuming exercise, prone to errors and subjectivity
- Have a visual representation of its performance
Our team designed PowerBI Scorecards for human resources and management personnel with an understanding of the classic balanced scorecard model. Because every type of PowerBI Scorecards license supports an unlimited number of users, companies of all sizes can take advantage of it. Licensing prices vary according to the number of scorecards, so companies only need to spend according to their needs.
3. Registering for PowerBI Scorecards and activating your account
Before using PowerBI Scorecards, you must register for an account by following this link and clicking Try it now. You have the option to either log in using a Microsoft account, or create a new one with DevScope. In both cases, your login credentials are the only information we store when you use PowerBI Scorecards.

PowerBI Scorecards grants administrator privileges to the first account in your organization that registers for it. Everyone else with an email under the same domain will need permission from that administrator to access PowerBI Scorecards.
- If you are the administrator for your organization, you will receive an email with each request to access PowerBI Scorecards. To give access to any of your colleagues, go to Settings > Users. From this screen, you can also edit their role and remove access to PowerBI Scorecards.
- If you are a user requesting access, register, and wait for permission from your organization’s administrator. You will receive a confirmation email.
4. Navigating PowerBI Scorecards
PowerBI Scorecards greets you with a Global Vision of your organization when you access it. The first elements you will notice are the colored task boxes (filled, to fill, urgent, and expired), which are also represented in the month progress graphic below. A box to the right displays your organization’s monthly fill progress, and a Month Progress table below breaks down the filling by the user. This table includes a search function, should you need to check the progress of a particular user.

Finally, there is an activity feed to the right of the table. By clicking View Details, you gain access to the complete history of your organization’s KPIs filling.

The menu on the left lets you navigate between PowerBI Scorecards’ different areas. This guide will cover each in detail.
5. Configuring a KPI
To start configuring a KPI, select KPI > Configuration in the navigation menu. If you have more than 1 scorecard in your organization’s tenant, you can switch between them by using the Search Scorecard dropdown menu. You can also filter by KPI name in the search bar beside it.

Click the Create button with the + sign on the top right corner to open the KPI configuration screen.

5.1. Configuring a KPI: the general tab
The general tab presents us with the following options:
- Code, name, and description – custom fields where you can attribute an internal code, name, and write down this KPI’s description.
- Accountable – the email of the person responsible for this KPI. Select one from those registered in your tenant.
- Periodicity – the recurrence with which a user should fill this KPI. Choose between a month and a year.
- Polarity – the direction in which you wish to measure this KPI. Choose between an ascending or descending value.
- Unit – your KPI’s measurement unit.
- Fill until – the top limit your KPI can hit until it is filled. If your polarity is descending, treat this as a negative value.
- Aggregation mode – turn on aggregated if you want this KPI to work in conjunction with others. After selecting “Aggregated”, you must set if this KPI should be part of a SUM, a Rate or a Ratio.
- Fill type – choose between manual or automatic filling. The latter will prompt you to select the connection string that automates this KPI. Choose between DAX, SQL or Power BI, and paste the current and current accumulated in their respective boxes. If Automatic filling is also selected, you must paste the Formula, Numerator, and Denominator.
When you’re done, hit the Save button.
5.2. Configuring a KPI: the Targets tab
In addition to the General tab, you have a Targets tab that becomes available once you save your KPI’s general settings.

By default, each new KPI becomes associated with your internal target. To associate it with a secondary target instead, click the dropdown menu and select it. Additionally, you may set a date for your target, and also add it to an area or sub-area.
When you’re done configuring your KPI, click the Save button on the top right corner of the screen.
If you ever need to edit or delete a KPI, go to KPI > Configuration and click the corresponding button next to it.
6. Configuring a scorecard
To start configuring a new scorecard, click Scorecard > Configuration on the navigation menu. Then click Create on the top right corner of your screen to open a modal window. You must name your scorecard and set at least 1 hierarchic level.

By default, each level you add will have the same color, but you should click the color square to open a palette and select a different tone for each of your hierarchic levels. You are free to change their name as well. In addition to this, you can associate a Power BI to the scorecard by pasting its link in the corresponding field.
Note: you can’t change the number of hierarchic levels in your scorecard after creating it.
When you’re done, click Create New and your scorecard will be available from the list. Click the Edit button to go to the scorecard setup screen, where you can add your KPIs.

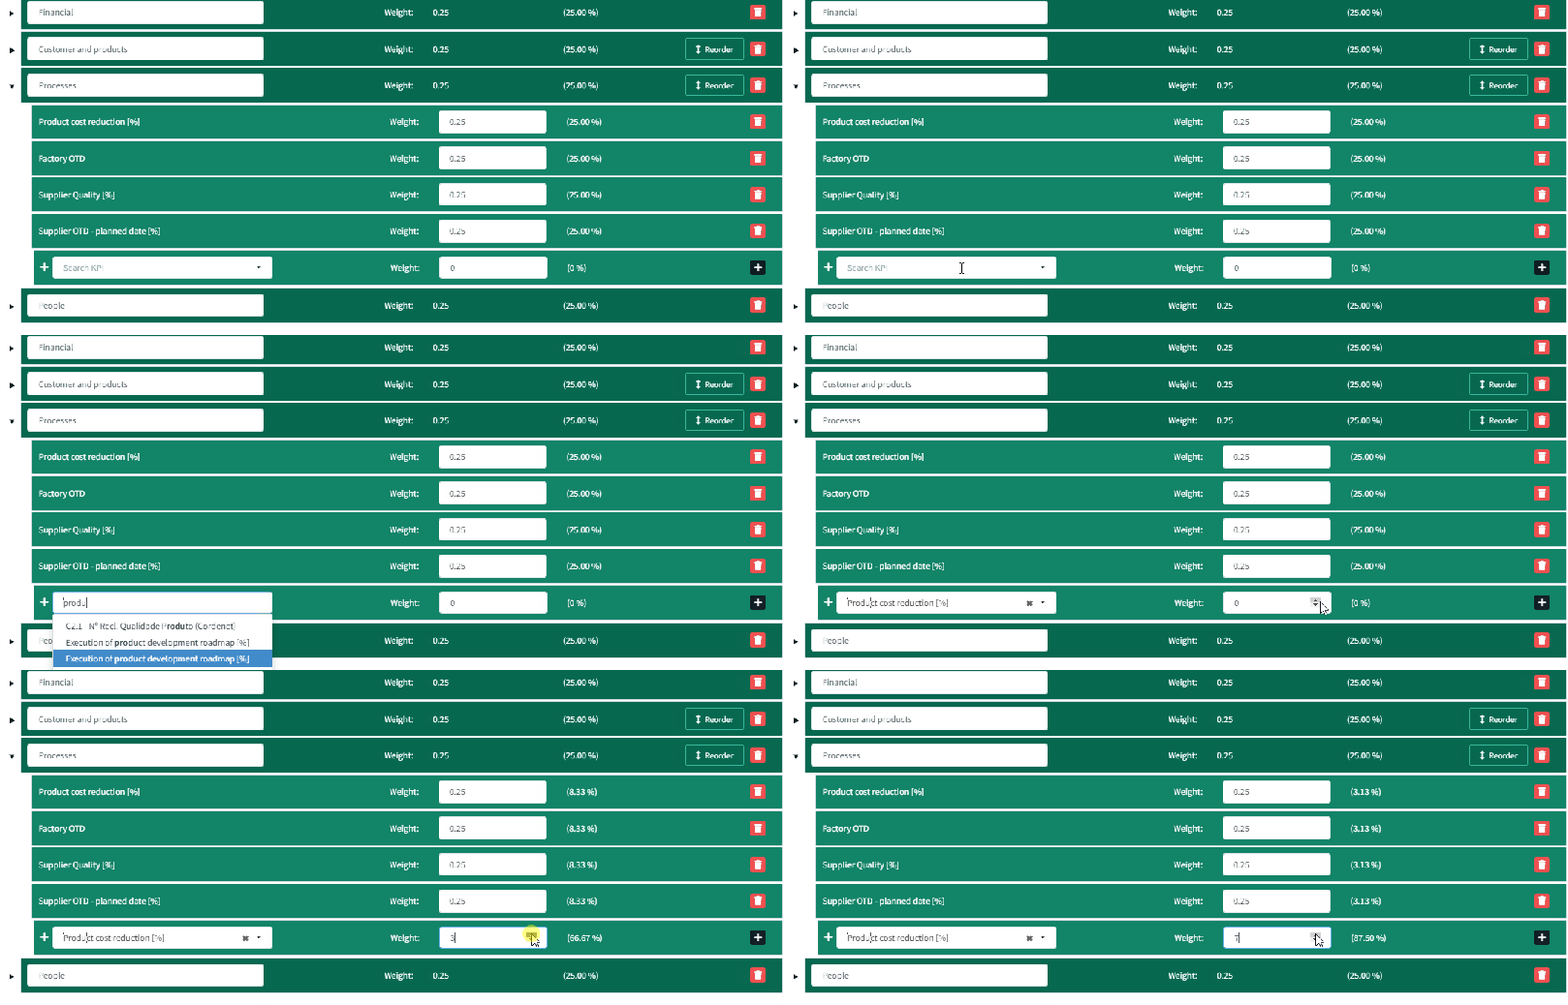
Each scorecard is made up of several combined KPIs you should have previously created. By clicking the down arrow in the Search KPI field next to the + sign, you can navigate your list of KPIs and add them to a hierarchic level. Alternatively, enter the name of the KPI and let the engine search for it. After adding a KPI, you should assign a weight (percentage) to it. If you enter a conflicting value, PowerBI Scorecards will automatically attribute the correct percentage to it, as shown below:

You can build a hierarchy of KPIs by pressing the arrow next to each level and repeat the process. Remember that the number of hierarchic levels in your scorecard is set during the creation process and can’t be changed afterward.
When you’re done, click the save button on the top right corner of the page.
7. Importing/Exporting scorecards and KPI targets
If your organization already has a scorecard system in place, and you are savvy enough with scorecards and KPIs, it might save you some time by manually importing them through Excel.
Start by going to the Import/Export section in the navigation menu and select either Scorecard or Targets (KPIs). The import process is the same, although the input method differs. Let’s start by taking a look at importing a scorecard.
The first thing you should notice is the orange banner prompting you to download an Excel template. Once you download it, click it to open an Excel file with 6 tabs: Help, Scorecard, KPI, KPIformulas, KPITargets, and KPIValues.
Follow the instructions in the Help tab to fill the template. Once you’re done, go to the second tab, Import Scorecard, and drag the Excel file to the corresponding area. Your file will show up in the next box alongside a blue button to upload it to PowerBI Scorecards. There’s also an orange button to cancel your upload and a red one to remove the file. If there any errors occur during the upload process, you can find them in the third tab, Import details.
Importing KPIs follows the same process. Go to the Targets section under Import/Export and download the KPIs Excel template. This template contains only 1 tab with 9 different columns.
Once you’re done, follow the same upload process described above.
8. Connecting Power BI to PowerBI Scorecards
One of PowerBI Scorecards’ unique selling points is the ability to use Power BI to visualize your organization’s scorecard. If you haven’t checked the Help Center in PowerBI Scorecards’ backoffice, we will break down the steps you need to follow to be able to visualize your scorecard in Power BI.
First, you must connect PowerBI Scorecards to your Power BI account by installing a PowerBI Scorecards connect app. To do so, click here. You will be directed to your organization’s Power BI Online page and prompted with the following:

Click Install to proceed. Once it’s finished installing, click connect in this modal that will show up:

Select connect and, in the next screen, click sign in without touching the default options (Anonymous authentication method, and privacy level setting set to None). Then, you will be prompted to update the required parameters.

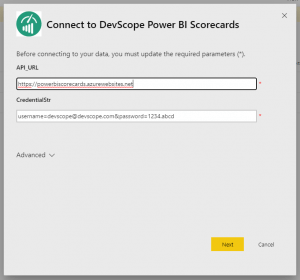
In the API_URL field, paste the following: https://powerbiscorecards.azurewebsites.net/. Then, in the CredentialStr field, enter your credentials using this format: (username=youremail@domain.com&password=12345678). To find your unique PowerBI Scorecards password, enter your organization’s PowerBI Scorecards’ backoffice, go to the Help Center, and click the Power BI tab. You will find it in bold type along with these instructions. Click next.
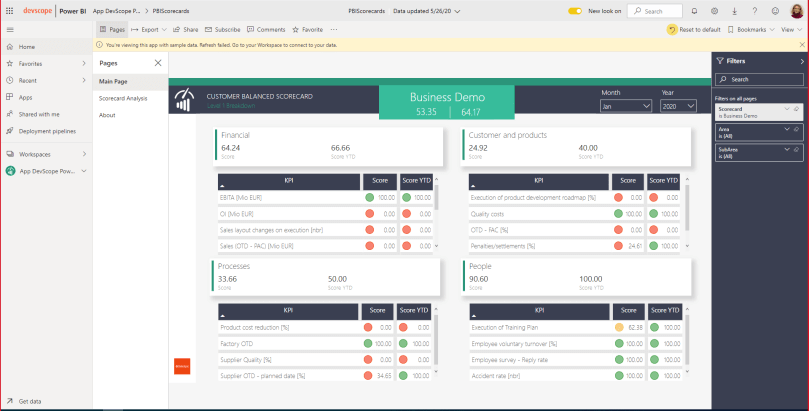
The application will start loading your scorecard into Power BI Online. The process may take between a few seconds to a few minutes, depending on the size of your scorecard. Once it’s finished, PowerBI Scorecards will become available as an app, and you will be able to see your organization’s scorecard in Power BI Online.

Thank you for reading our PowerBI Scorecards 101, and using our product. If you still have any questions or run into some issues, feel free to contact our team at support@devscope.net.

Filter by List: new features and pricing
Filter by List is a Power BI visual by DevScope that lets users apply filter values in bulk to a report. Find out what's new.

