How to embed Power BI in PowerPoint

Joel Monteiro
2018-06-14One of the most requested features users ask Microsoft is the ability to embed Power BI visuals in Office 365 documents, particularly PowerPoint. Since 2016, Power BI users can export to PowerPoint (in preview mode), but the process is far from perfect. Reports have to be exported in their entirety, and the whole process can be very time-consuming, depending on the length of the exported Power BI report or dashboard.
As it happens, Power BI users often need just a single report page or specific visual. Consequently, they resort to reliable but impractical and time-consuming screenshots and copy-pasting gymnastics.
After receiving many requests from clients and hearing the pleas of Power BI users, our products team came up with a solution: PowerBI Tiles. Power BI Tiles is an Office 365 add-in that lets users embed Power BI on PowerPoint, Word, and Outlook. You can use this add-in in both the Mac and Windows versions of Office 365.
A few months later, our team came up with PowerBI Tiles Pro, an add-in for the desktop version of Office 365 that allows you to embed Power BI reports, dashboards, or single visuals as high-definition static screenshots. In addition to PowerPoint presentations, this add-in is also compatible with Word documents and Outlook emails.
You can see both PowerBI Tiles and PowerBI Tiles Pro in action here:
In this article, we will show you both versions of Power BI Tiles Pro, each targeted at specific needs:
1- PowerBI Tiles Pro Online embeds a live Power BI report to a PowerPoint presentation
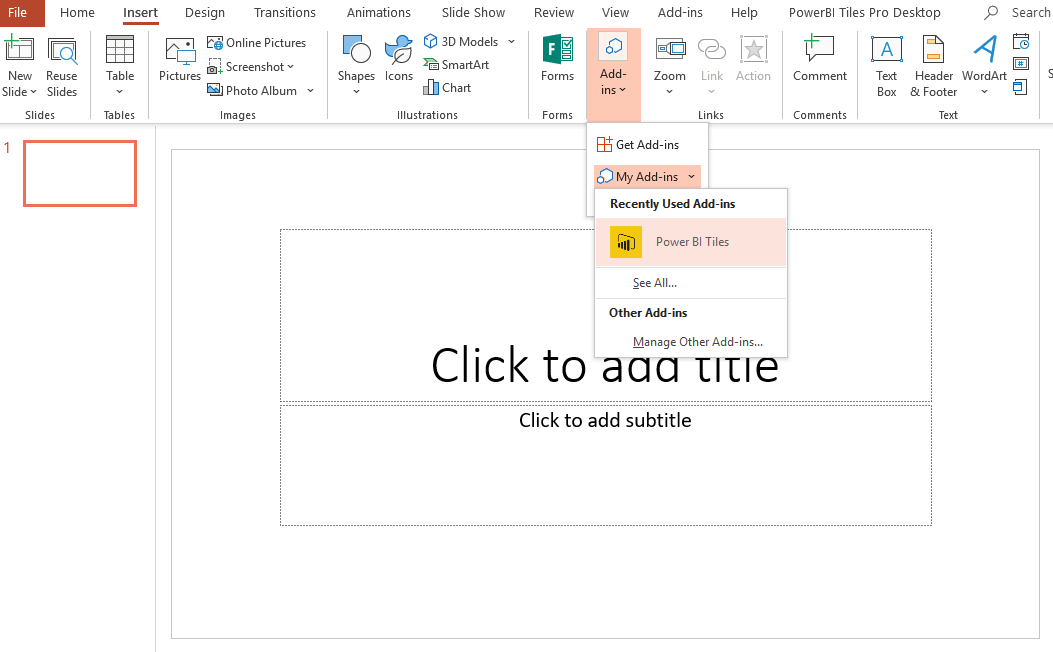
You can embed a Power BI report in PowerPoint in the same way you would insert a picture, audio clip, or video. Click here to download the PowerBI Tiles add-in from the Microsoft App Source store. Alternatively, you can search for it by accessing the Office Store from PowerPoint. Go to the Insert tab, click Add-ins, and then Get-Add-ins. From here, you can access the Office Store, and search for Power BI Tiles. After installing it, select Power BI Tiles from the My Add-ins drop-down menu.

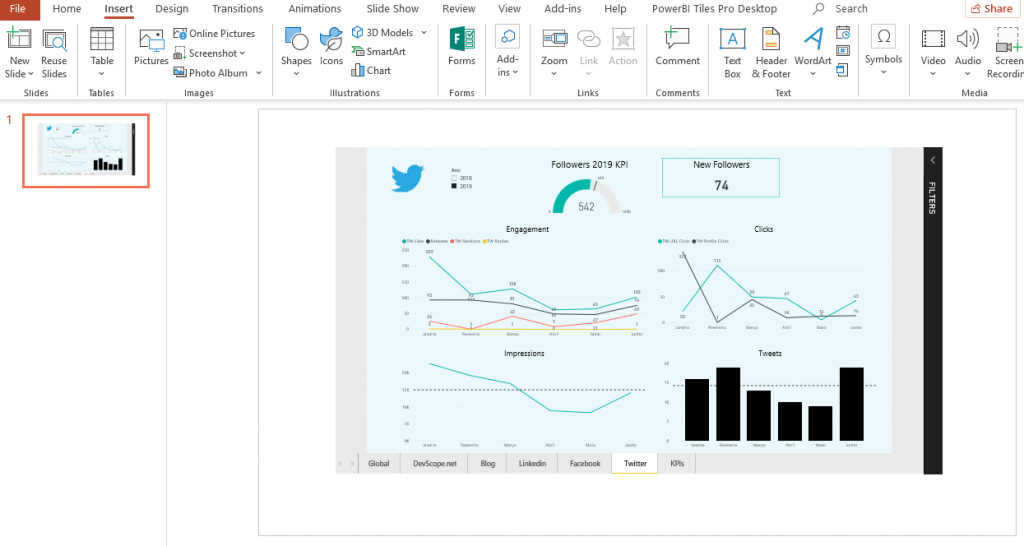
After clicking the PowerBI Tiles add-in, log in to your Power BI account, and select the dashboard and tile you wish to embed in your presentation. You can navigate your company’s workspaces, and between dashboards and reports. Alternatively, you can choose to paste a Power BI public report.

And that’s it. You can repeat the process on the same slide or presentation, although we recommend no more than 10 to avoid performance issues.
2- PowerBI Tiles Pro Desktop embeds screenshots of Power BI visuals on PowerPoint presentations (as well as Word documents, and Outlook emails)
Click here to download a free trial of PowerBI Tiles Pro from the product’s website. You can use this trial version without any limitations, save for a red watermark in your reports. The downloaded .zip file contains three different executable programs, one for PowerPoint, one for Word, and a third for Outlook. Although PowerBI Tiles Pro works on all of them, this article will focus on using it in PowerPoint only.
After installing PowerBI Tiles Pro, open PowerPoint for Office 365 and go to the PowerBI Tiles Pro Desktop tab. Log in to your Microsoft account, and choose between:
- Add Power BI – a window will pop up with a list of your Workspaces, containing any dashboards, reports, and single visuals. Tick the boxes of the ones you wish to add to your presentation and click Add Items. The items you selected will be distributed by single slides.

- Add from URL – a window will pop up prompting you to paste the URL of a dashboard or report published on the web. This URL is the one in your browser’s window, not the one you get by clicking Share on Power BI Online.

And you’re done.
Updating a PowerPoint presentation with embedded Power BI reports
If you have a meeting coming and need access to the latest figures, you don’t have to repeat the whole process. Just select the Power BI visuals you need to update and hit the Refresh button. Any formatting applied to your previous reports will be kept. In other words, you just saved yourself a lot of time pressing Ctrl + C and Ctrl + V.
Unlike real-time reports, you can add as many screenshots to your presentations with PowerBI Tiles Pro as you wish. Changes in performance won’t be noticeable.
Trial vs full version: what's the difference?
Unlike real-time reports, you can add as many screenshots to your presentations with PowerBI Tiles Pro as you wish. Changes in performance won’t be noticeable.
As previously mentioned, you can use the PowerBI Tiles Pro trial version without any limitations, save for a red watermark. If you wish to update to the full version of PowerBI Tiles Pro and remove this watermark, a 1-year license is available for only 99,99€. If you or your company wishes to purchase multiple licenses, the price per unit decreases considerably. You can also contact our team if you are looking at purchasing over 100 licenses to get an even heftier discount.
You can download the PowerBI Tiles Online add-in for free from AppSource, Microsoft’s online store for professional applications. The trial version of PowerBI Tiles includes the following limitations:
- MyWorkspace is limited to 5 dashboards and 5 reports visuals.
- Visuals will have a red watermark on them.
- An advertising banner is placed on the report selection screen.
An annual PowerBI Tiles Pro license also unlocks all features in PowerBI Tiles Online.
If you need any help using PowerBI Tiles Pro, please check the product’s 101 guide or contact our support team by email.

We have achieved Microsoft Gold Cloud Productivity Competency!
DevScope has attained the Gold Cloud Productivity Competency from Microsoft, demonstrating our commitment and expertise in building, integrating and extend[...]

