PowerBI Portal 2.0 is here and is full of new features

Joel Monteiro
October 12, 2021PowerBI Portal 2.0 is here, and we’re going to fill you on everything new in the latest update to our web tool for massive Power BI report sharing.
Released last year, PowerBI Portal allows users to embed any number of Power BI reports and dashboards on a web portal and give access to it to whoever they want, regardless of being in their organization or even having a Power BI account. It also features a cost optimization system that allows organizations to turn reports off and on according to activity instead of letting them be perpetually available in the cloud. This simple on and off switch can result in tremendous savings in Azure hosting costs, and the larger the number of reports shared, the larger the savings.
Version 2.0 is, by far, the biggest update to PowerBI Portal and introduces many features to the front and back office users have been asking our team for. Let’s go over them one by one.
What’s new in PowerBI Portal 2.0’s front office:
New login page
The first thing front office users will notice when using PowerBI Portal is the new login page. It’s cleaner, more appealing, and supports Microsoft, Google, and Facebook login in addition to the Access code generated by in the back office.

Revamped user interface with reports grouped by area
Once you log in, you’ll notice that PowerBI Portal’s user interface is also completely new. Our team made the front office much easier to navigate with reports now grouped by area. As in the previous version, you can also switch report areas in the top left corner of the screen.

Reports can now be saved as favorites
Another much-requested feature is finally available in PowerBI Portal. If you deal with many reports, you can now save some as favorites, so they are the first ones available in each area.
What’s new in PowerBI Portal 2.0’s back office:
List and import users directly from the organization’s Azure AD.
A feature that will surely speed up the process of adding users to PowerBI Portal at larger companies is the ability to import them directly from the organization’s Azure Active Directory. From the Users tab, click “Import from Azure AD” on the top right corner of the screen. Next, click “Load users from Azure Active Directory” and all users from your organization will be listed below. You can assign their roles or remove them from PowerBI Portal. Press Save at the bottom of the screen when you’re finished.

Report access and Power BI Embedded configuration can now be tested from the back office.
You can now test if Power BI Embedded is correctly configured and working by clicking the report connection button next to each report in the Reports tab.

Report backgrounds and thumbnails can now be edited
The Edit report tab now allows users to set their thumbnails to round images, with the default being a square image. Additionally, companies can now choose to apply transparent backgrounds to their reports in order to display their branding. This option is also available when choosing the report’s visual to display.

The Power BI Embedded warming up page message can be customized in the Settings tab
PowerBI Portal’s warming up page can now be customized with your organization’s message. To do so, go to the Appearance tab under Settings and navigate to the bottom option.

Visuals can now be individually selected to be displayed on the report page
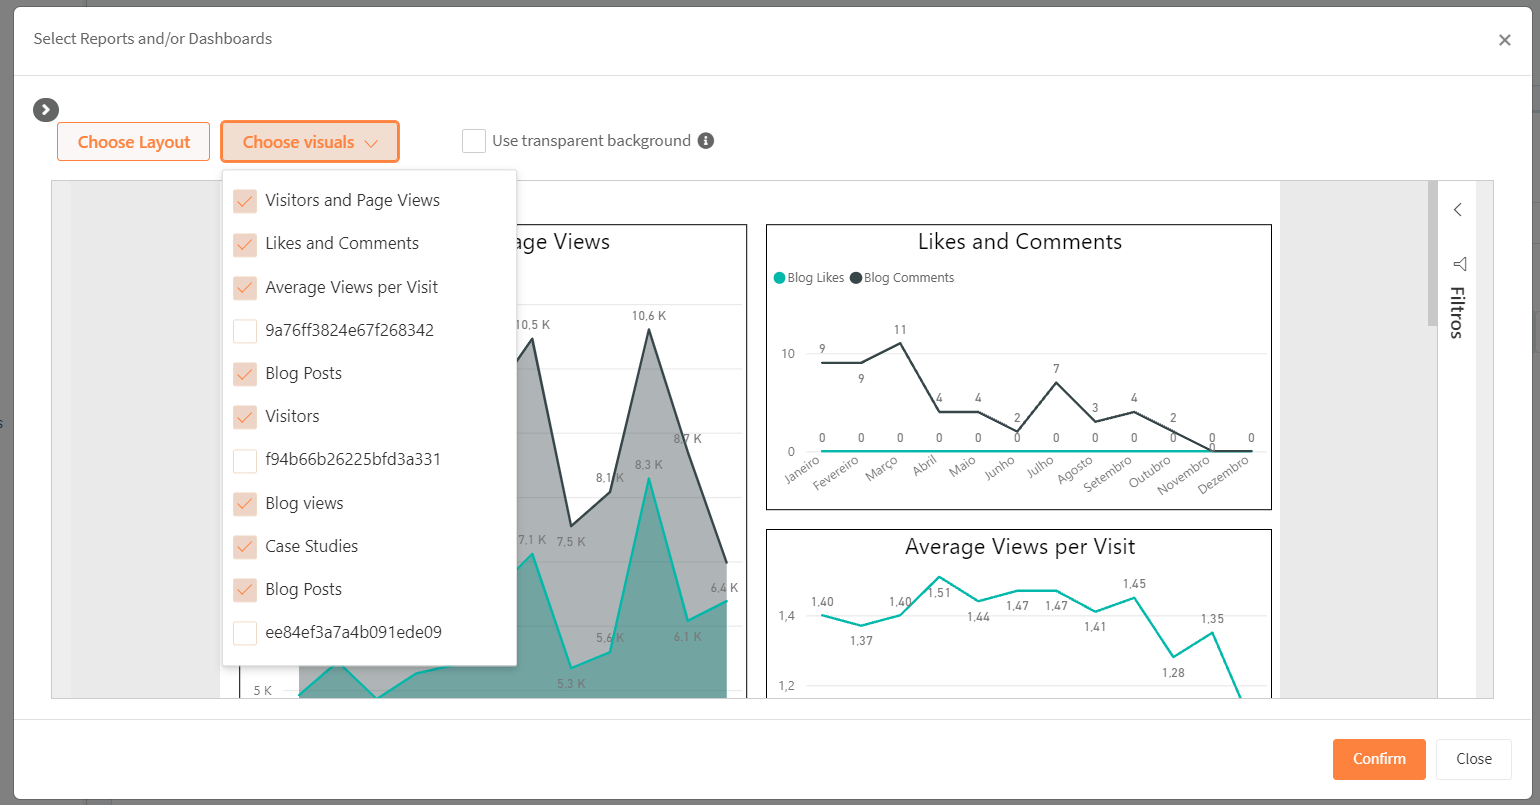
Instead of displaying an entire report in the front office, back office users can now set which individual visuals are displayed to front office users. From the Reports tab, click the open report button next to the report you want to edit. After selecting your report from the navigation tree on the left, two orange buttons will become available: Choose layout and Choose visuals. The Choose layout button allows you to choose 1 of 6 different ways to display your report’s data, while the Choose visuals layout lets you choose exactly which visuals from your report will be displayed to front office users.

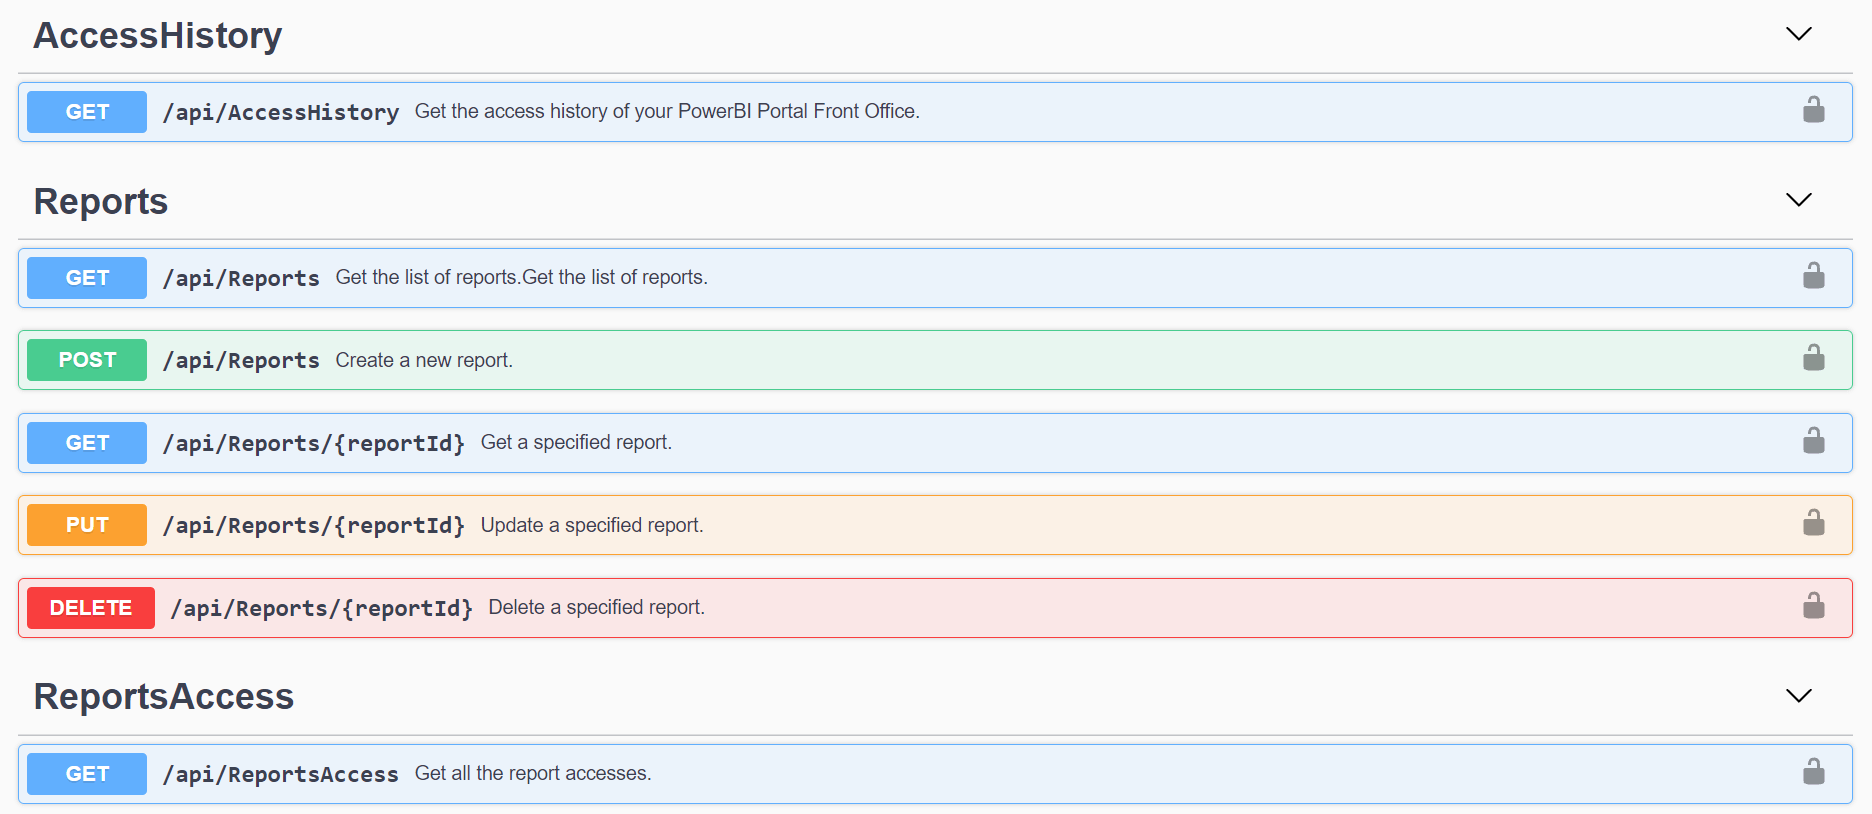
Developers now have access to PowerBI Portal’s API
A new API allows developers to manage users, users’ claims, reports, reports access, and user access history.

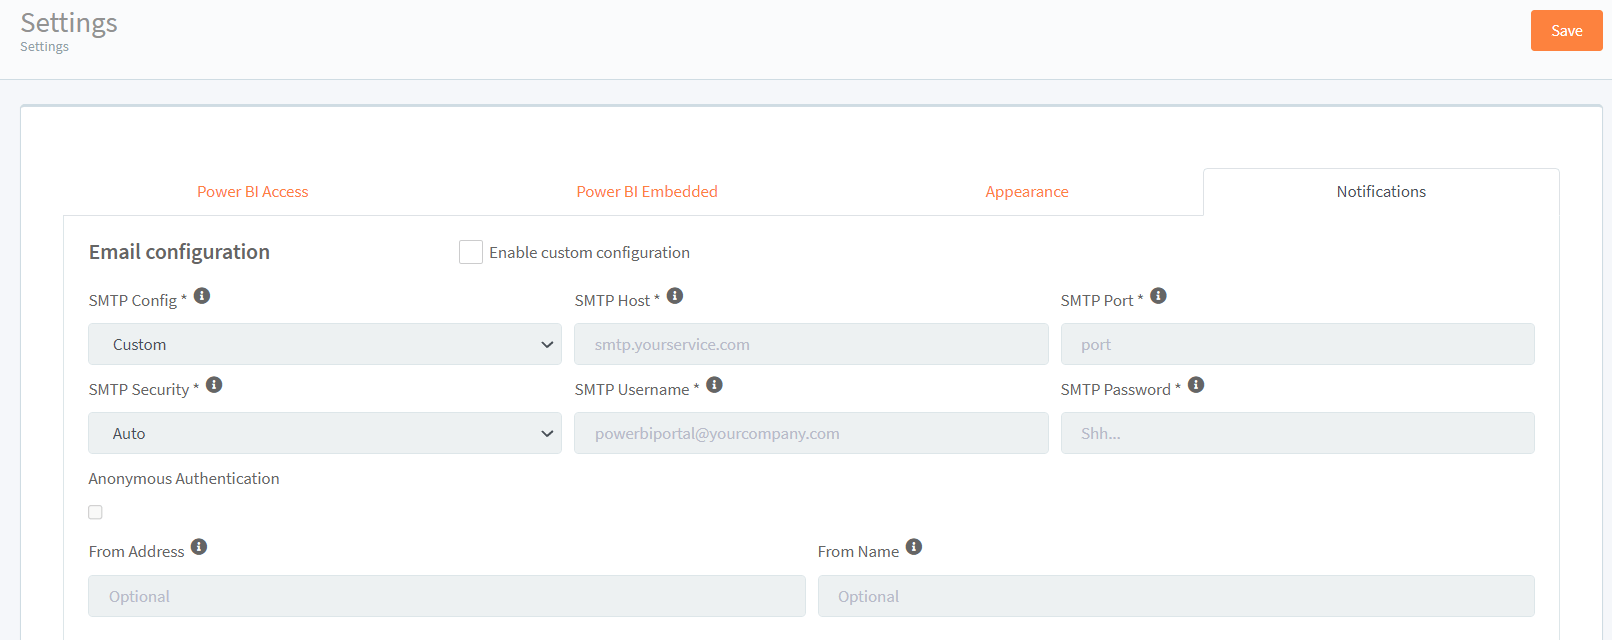
Ability to configure SMTP
Organizations can now use their email server to send PowerBI Portal emails instead of [email protected]. You can find SMTP configuration in the Notifications tab under Settings.

Improved error messages’ description
To help users better solve issues with PowerBI Portal, warning messages are now more descriptive and feature links to the pages where the issue can be solved.

To start using PowerBI Portal 2.0, simply log into your account. If you run into any issues using PowerBI Portal 2.0 or have some features you’d like to see in our product, contact our team at [email protected].

Joana Barbosa is DevScope’s new BI team manager
Joana Barbosa is the new leader of DevScope's Business Intelligence team.
